|
The INTERNATIONAL JOURNAL of APPLIED RESEARCH In Veterinary Medicine |
 |
| Current Issue |
| Previous Issues |
| Reprint Information |
| Back to The International Journal of Applied Research in Veterinary Medicine |
The Significance of
an Exposure to Actinobacillus pleuropneumoniae For the Fecal Coliform
Microflora and the Digestibility of Nutrients in Specific Pathogen-Free
Pigs
M. Zoric, DVM,
A. Arvidsson, DVM*a
L. Melin, DVM, PhD
I. Kühn, PhD§
J. E. Lindberg, MSc, PhD*
P. Wallgren, DVM, PhD,
National Veterinary Institute, Uppsala, Sweden
Department
of Large Animal Clinical Sciences, Swedish University of Agricultural
Sciences, Uppsala, Sweden
*Department of Animal Nutrition and Management, Swedish University of Agricultural Sciences, Uppsala, Sweden
§National Laboratory for Bacteriology, Microbiology and Tumorbiology Centre (MTC), Karolinska Institute, Stockholm, Sweden
aPresent Address: National Food Administration, Uppsala, Sweden
This study was financed by grants from the Swedish Council
for Forestry and Agricultural Research.
KEY WORDS: pig; A. pleuropneumoniae; intestinal health, diarrhea, stability; diversity; coliforms; nutrient; digestibility; villi; glucose; urea
ABSTRACT
The goals of this study were to determine the effect of an experimentally induced lung infection on the gastrointestinal functions. Five specific pathogen-free (SPF) pigs were infected intranasally with Actinobacillus pleuropneumoniae, and five were left as controls. The outcome of the challenge was monitored by registrations of clinical parameters, growth, feed utilisation, and by defining the digested part of the feed consumed. Serum glucose and urea concentrations were defined, and the intestine was scrutinized by histology and by phenotyping the fecal coliform flora. Challenged pigs expressed signs of respiratory disease, depressed appetite, and a decreased growth rate. Also the stability, that is, the phenotype similarity of the fecal coliform flora between pigs within group, was lower within the infected group (Sp values, mean 0.35 vs. 0.49), possibly because of the infection and depressed appetite. Obviously, a larger number of coliform clones had been allowed to proliferate in the infected group. Combined with a somewhat shortened height of the intestinal villi of the ileum (P < .05), this may indicate an increased risk to develop enteric disorders among respiratory diseased conventional pigs. However, none of our SPF pigs developed diarrhea after the respiratory challenge. In this context, we should note that the pathogen load of the environment, apart from presence of A. pleuropneumoniae, was extremely low. The bacterial challenge did not influence the serum concentrations of glucose or urea. A somewhat higher digestibility of nutrients was obtained among the infected pigs close to the challenge. However, this was suggested to be an effect of an increased relative retention of nutrients from the gut induced by a decreased intestinal motility because of the illness.
INTRODUCTION
Stressful situations such as weaning or transfer of pigs to new facilities are proven to affect immune functions in a negative way, and the discomfort of the animals can also be reflected by reduced growth.1 During such circumstances, researchers have shown that the composition of the microbial flora of the intestine alters by proliferation of certain clones of bacteria on behalf of other strains.2 Therefore, the diversity of that flora will decrease, which in turn may lead to an increased susceptibility to intestinal infections, because a high diversity is suggested to protect from proliferation of potentially pathogenic micro-organisms of internal or external origin.2 Indeed, a decreased diversity of the microflora has been recorded during diarrhea among suckling piglets, and a high diversity has been regained at recovery.2,3
Infections may influence the performance of pigs in a negative way4 by reducing feed intake, daily gain, and impair the feed conversion ratio. This is well elucidated by the improved performance obtained in specific pathogen-free (SPF) systems.57 It has been shown that, as part of the bodys defence against antigens, body protein synthesis is reduced and more body proteins are degraded.8 Thus, the overall metabolism in the animal may be affected. Clinical or subclinical respiratory diseases that affect the performance in a negative way are common among fattening pigs.9,10,11 One of the major agents associated with diseases in the respiratory tract of fattening pigs is Actinobacillus pleuropneumoniae.12 In general, the infection is causing a mild to subclinical disease, but acute to peracute manifestations with high mortality rates can occur.13 A clear-cut reduction of the weight gain is seen during acute manifestations of disease,14 but a reduced growth rate can also be seen during the convalescence period after recovery from clinical disease.15 Obviously, there are long-term effects caused by infections on the productivity of pigs, possibly achieved by systemic effects induced in the host. The common way to document this is to calculate feed utilization by dividing the amount of feed offered by the weight gained. However, pigs are fed penwise, resulting in large variation in weight gain because of diverging amounts of feed consumed.14 Consequently, calculations of mean feed use are uncertain at an individual level. Therefore, objective parameters such as glucose and urea content in serum, as well as the digested part of nutrients during the intestinal passage, could add valuable information about the individual feed utilisation.
The present study scrutinized the possible systemic effect of an infection in the respiratory tract. The goal was to find out what impact an exposure to a pathogenic strain of A. pleuropneumoniae would have on the gastrointestinal functions. The outcome of a challenge with A. pleuropneumoniae serotype 2 was monitored by registration signs of infection and by phenotyping the faecal coliform flora. Further the weight gain of the pigs and their use of the feed consumed was studied.
MATERIAL AND METHODS
Animals and General Experimental Design
The experiment was performed in SPF pigs (Serogrisen, Ransta, Sweden).16 At the age of 10 weeks, 10 SPF pigs were transferred to the National Veterinary Institute (NVI), divided into two groups with 5 pigs in each group, and left for acclimatization for 8 days (days 8 to 1). Each group was housed in a separate room with exclusive urine and manure handling. The rooms were illuminated for 14 hours per day and had a temperature of 20˚C; the air was recycled 15 times per hour. All utensils and shoes were designated to and kept within each room. The rooms were visited in a specific order starting from the uninfected controls. All personnel washed hands, arms, and feet between rooms. After each round, they showered and all clothes were autoclaved.
One group was used as uninfected controls, while the other group was intranasally infected with 109 colony forming units of a pathogenic strain of A. pleuropneumoniae serotype 2 (NVI 700/89) at day 0.14,17 The bacterial suspension was instilled into one nostril of unsedated pigs and that nostril was clogged for the consecutive five inhalations. The trial was ended on day 17 after infection. On that day, the pigs were euthanized and necropsies were performed.
The pigs had free access to water and were fed a commercial dry feed without antibiotics or growth promoters (Singel Flex, Lantmännen, Svalöv, Sweden). The feed rations were calculated from the mean body weights of the pigs18 and adjusted each week. Feed intake was monitored daily, and feed refusals were recorded. Appetite was defined on a scale from 0 (refusal) to 5 (all feed consumed). Feed conversion was calculated by dividing feed offered and feed consumed, respectively, with the weight gained. The weight of the animals was monitored individually with a calibrated scale (Epescale-1045, Alfa-Laval, Södertälje, Sweden) on days 8, 1, +7, and +17 in relation to the day of infection, and the daily weight gains were calculated.
Respiratory Signs
The health status of the animals was recorded daily throughout the study. Respiratory signs were scored using a scale ranging from 0 to 3, in which 0 corresponded to the absence of clinical signs; 1 corresponded to moderately forced breathing; 2 corresponded to moderately forced breathing and sporadic wet cough or severely forced breathing; and 3 corresponded to severely forced breathing and intermittent wet cough. In total, the respiratory signs were scored 20 times for each pig after the exposure to A. pleuropneumoniae.
Collection of Blood and Analyses Performed From These Samples
Blood samples were collected by jugular vein punctures using evacuated glass tubes without additives on days 0, +2, +4, +7, +13, and +17 in relation to the day of infection. Glucose and urea were measured in serum by commercial enzyme linked immunosorbent assay (ELISA) kits (MPR 2, kit 1442 449, and kit 777 510, respectively, Boeringer & Mannheim, Mannheim, Germany). Serum antibodies to A. pleuropneumoniae serotype 2 were detected by an indirect ELISA previously described.19 The cut off-value was defined as A450 = 0.3 in serum diluted 1/1,000 in phosphate buffered saline.
Collection of Fecal Samples
The first fecal sample from each pig was collected before infection with A. pleuropneumoniae. Fecal samples were also collected on days +2, +4, +7, and +13 in relation to the day of infection.
Fecal samples for nutritional measurements were collected in plastic jars, and the samples were frozen at 20˚C. Before analysis, the samples were dried at 60˚C and milled (1.0 mm screen). Digestibility was calculated using hydrochloric acid insoluble ash, measured according to McCarthy et al.,20 as an indigestible marker. Dry matter content and ash content of the feces were determined according to Jennische and Larsson.21 Crude protein (Kjeldahl-N) was analyzed according to the Nordic Committee on Food Analysis.22 All results are presented on a dry matter basis.
Fecal samples for bacteriologic analysis were collected with sterile cotton swabs, 3 cm into the rectum. These samples were cultured on MacConkey agar plates (Difco 075, Sparks, MD) within 2 hours. After 24 hours of aerobic incubation at 37˚C, 24 coliform colonies were picked at random from each sample for biochemical fingerprinting.23 In total, 50 rectal samples were examined, representing a total number of 1,200 bacterial isolates. The PhP-RS plate (Ph Plate AB, Stockholm, Sweden) that comprises of microtiter plates with 11 different dehydrated reagents was used.3 All data handling, including optical readings, calculation of diversity indexes of populations24 and similarity coefficient of populations (Sp values)25 were performed using the PhP software (Ph Plate AB).
Postmortem Examinations
To document the health situation of the pigs, macroscopic pathologic lesions were recorded at necropsy on day 17 after infection. The magnitude of pneumonic and pleuritic lesions were defined as percentages of the total volume of the lungs and of the total area of the pleura affected, respectively, as previously described.14 In addition, attempts to isolate A. pleuropneumoniae were made. Samples were cultured on horse blood agar plates cross inoculated with a feed strain (Staphylococcus aureus), incubated in 10% CO2 at 37˚C, and read after 24 and 48 hours.
Samples for microscopic examinations were collected from 4 different locations of the gut; 2 m distal to the pyloric orifice; 2 m proximal to the ileocecal ostium; at the ileum; and at the turn of the colonic spiral. These samples were collected in phosphate buffer (1/15 M, pH 7.2) and fixed in glutaraldehyde (2.5%, pH 7.2) for 24 hours before being stained with hematoxylin and eosin. The height of the villi, the depth of the crypts, and the amount of goblet cells were measured and counted microscopically on three locations for each section of the gut, and the mean value was calculated for each pig.
Statistical Methods
The significance of differences between groups were determined with the Mann-Whitney U test, and the significance of differences between consecutive sampling occasions within groups was determined with the paired Students t test and the Wilcoxon signed rank test.
RESULTS
Clinical Observations
The control group (n = 5) did not develop any clinical signs of disease during the experiment (Table 1). In contrast, all pigs in the infected group (n = 5) expressed signs of respiratory disease from 20 hours after infection onwards. These signs lasted until the end of the trial. None of the pigs showed any signs of diarrhea during the trial.
Feed Intake and Daily Weight Gain
During the acclimatization period, the appetite was somewhat decreased in both groups, but later the control group consumed all feed offered (Table 2). The groups performed equally before infection. After the acclimatization of 8 days, body weight increased significantly (P < .05) in both groups, despite the fact that one group was challenged with A. pleuropneumoniae. From 7 to 17 days after infection, weight gain further increased (P < .05) in the control group but not in the infected group.
Serology
Before challenge, all animals were seronegative to A. pleuropneumoniae serotype 2. On day +7, three of the infected pigs expressed serum antibodies to A. pleuropneumoniae, and all of the infected pigs (n = 5) were seropositive on days +13 and +17. The uninfected group remained seronegative throughout the study (Table 1).
Demonstration of A. pleuropneumoniae and Pathology
At necropsy, A. pleuropneumoniae were shown by cultivation in lung, bronchus, and lung abscess in pig I 30, and in a lung abscess in pig I 33. The microbe was not shown in the control pigs. The macroscopic observations made at necropsy are summarized in Table 1. No signs of respiratory disease were seen in the control group. In contrast, four of five infected pigs experienced both pneumonia and pleuritis. The fifth pig in that group did not show any macroscopic lesions in the respiratory tract. The pneumonia affected in average 6.4 ± 5.4 % of the total lung volume and the pleuritis 13.4 ± 11.7 % of the total pleural area among the infected pigs. No macroscopic pathologic lesions were seen in the digestive tract of any pig.
The microscopic examinations revealed alterations in height of villi, depth of crypts, and density of goblet cells between different sections of the intestinal tract. The height of the villi of the infected group was at all locations investigated inferior to that of the control group (Table 3). However, this difference was only significant (P < .05) in ileum. The density of goblet cells in the control group never exceeded that of the infected group, but no significant differences between groups were recorded. No differences between depths of crypts were recorded between the groups (Table 3).
Concentrations of Glucose and
Urea
in Serum
The concentration of glucose in serum ranged from 6.3 ± 1.0 to 7.0 ± 1.4 mmol/L. There were no significant differences in concentration of serum glucose between the groups during the sampling period. The serum urea ranged from 1.5 ± 0.3 to 2.5 ± 0.4 mmol/L, and no differences between groups were found.
Digestibility of Nutrients
The amount of crude protein and organic matter used during the intestinal passage is shown in Table 4. On day 2 after challenge, a higher digestibility of crude protein was seen for the infected pigs (P < .05). The digestibility of organic matter was higher (P < .05) among the infected pigs on day 2 and day 4 after infection. No significant differences were seen in the fecal dry matter content between the uninfected group (24.0 ± 1.3% versus 25.1 ± 0.6%).
Diversity and Similarity of Fecal Coliform Bacteria in Pigs
The diversity of the fecal coliform flora in each sample was calculated as Simpsons diversity index. The diversity varied between sampling occasions and pigs, but the median diversity value for the infected group and uninfected group were the same (0.81; Table 3).
As shown in Table
5, the two pigs (C0 and C2) with the lowest diversity values (0.63 and
0.57) were littermates, and they belonged to the uninfected group. The
pig (I30) with the highest diversity (0.93) belonged to the infected
group and did not have any littermate participating in the study. When
littermates in different groups were compared, a higher diversity was
recorded among noninfected pigs in three of four comparisons (Table
5).
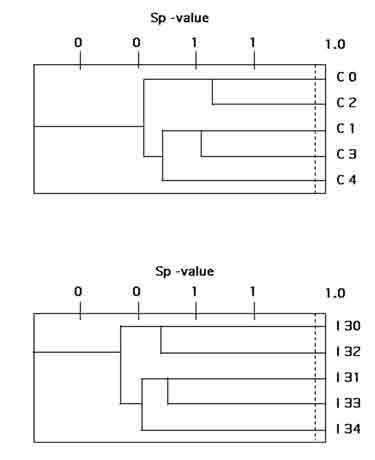
The similarity between coliform floras of group mates, including all isolates from all sampling days, was calculated as similarity coefficient of populations (Sp coefficients). A pairwise comparison between the pigs within each group revealed a higher mean Sp value in the control group than in the infected group (0.49 versus 0.35; Table 3; Fig. 1). Similarly, the coliform flora was more stable over time among the control pigs. When the coliform populations collected at the different days were compared within group, the mean Sp value obtained among the control pigs was 0.36 compared to 0.20 among the infected pigs.
As shown in Table 5, the comparison between two uninfected littermates (C0 and C2) gave the highest Sp value (0.65). The Sp values between littermates allotted to different groups were lower. In litter C, the intestinal flora of the infected pig with the most pronounced response to the challenge (I32) differed from the floras of its littermates, whether they were challenged or not (Table 5).
DISCUSSION
The challenge with A. pleuropneumoniae was successful according to the clinical, serologic, and pathologic results obtained, as well as by the re-isolating of the micro-organism from infected pigs. Corresponding well to earlier observations,14 the decreased weight gain of the infected pigs was correlated to the development of clinical signs of respiratory disease and to a reduced feed intake of the challenged pigs. Disease, in particular fever, has been shown to have a negative influence on feed intake.26
No signs of enteric disorder were recorded during the
study. However, this was not unexpected because the trial was performed
using SPF pigs that received a lung infection alone, and the pathogen
load of the environment was low. Still, the numerically higher feed
conversion of the control pigs may indicate a more efficient feed use
of the control pigs and was in line with others reports.4,7 The higher
total tract digestibility of crude protein and organic matter among
the infected pigs close to the bacterial challenge was probably caused
by a reduced motility in the bowel, with an increased time of retention
and digestion by intestinal microbes as a result. Plasma levels of glucose
and urea remained within the normal range for growing pigs,27 indicating
that the infection was mild and without any major effects on the overall
metabolism.
To further investigate the influence of the respiratory disease on the digestive tract, a highly discriminating biochemical phenotyping of the fecal coliform flora of the pigs was adopted.28,29 Under normal conditions, the intestinal flora is composed of diverse groups of bacterial strains, which is important for the nonspecific resistance to infectious diseases, a phenomenon that is referred to as colonization resistance.30 During the active course of the respiratory disease, the growth rate of the animals was decreased and the intestinal flora of pigs infected with A. pleuropneumoniae was somewhat changed. When comparing the phenotype similarity of the fecal coliforms within group an interesting difference was observed. The Sp values of the control group were superior to those of the infected group (mean values, 0.49 vs. 0.35), which indicate that the controls shared the same strains to a higher degree than the infected pigs. Because fever has a negative influence on feed intake,26 the lower stability within the infected group may have been caused by the infection and the depressed appetite. Previously it has been shown that the homogeneity of the enteric coliform flora among penmates in general is high.31,32 Because each experimental group included one pair of littermates, it is remarkable that the Sp value of the littermates in the control group was 0.65 over time, compared with 0.35 in the infected group.
Still, no large alterations were seen in the intestinal coliform populations, because the median diversity was equally high in both groups, and no great differences between the sampling days were seen in any of the groups. In concordance, no signs of diarrhea were recorded. In this context, it is important to note that our pigs were kept in extremely good environmental conditions with a minimum of external strain, conditions that are impossible to achieve within ordinary pig production.
Also the genetic variation of pigs that is described with respect to immune function,33 may influence the development of the enteric flora. Therefore, we should note that the two pigs with the lowest diversity were littermates, and both of them had been allotted to the control group, whereas the pig with the highest diversity had no littermate and was allotted to the infected group.
Taken together, these observations indicate an influence on the enteric flora of pigs because of regrouping and a subsequent challenge with a microorganism pathogenic to the respiratory tract. As indicated by the low Sp values, a larger number of different coliform clones had been able to proliferate in the intestine of the pigs that had been infected with A. pleuropneumoniae. This may in turn increase the risk for development of enteric disorders among pigs that have developed a respiratory disease. However, the differences obtained between the groups with respect to the fecal microflora and the digestibility of nutrients were minor, and their clinical importance should at the moment not be overestimated. Still, the diverging results obtained between littermates represented in the different groups call for enlarged studies with groups that are composed to complement each other with respect to genetic origin
ACKNOWLEDGMENTS
We thank Barbro Högberg and Per Carlsson for taking excellent care of the animals; Thomas Segall, Hans Kanbjer, and Stern Lundin for expert help when performing the necropsies; Yvonne Ridderstråle for microscopical consultations, and Sigbrit Mattsson, Maria Persson, and Anna-Greta Haglund for technical assistance.
REFERENCES
1. Wattrang E, Wallgren P, Lindberg Å, Fossum C: Signs of infections and reduced immune functions at weaning of conventionally reared and specific pathogen free pigs. J Vet Med B 45:717, 1998.
2. Katouli
M, Lund A, Wallgren P, et al: Phenotypic characterization of intestinal
Escherichia coli
of pigs during suckling, postweaning and fattening periods. Appl Environ Microbiol 61:778783, 1995.
3. Kühn I, Katouli M, Lund A, et al: Phenotypic diversity and stability of the intestinal coliform flora in piglets during the first 3 months of age. Microbial Ecol Health Disease 6:101107, 1993.
4. Stahly T: Impact of immune system activation on growth and optimal dietary regimens of pigs. In: Wiseman J, Garnsworthy PC, eds: Recent developments in pig nutrition. Nottingham University Press. Thrumpton, UK, pp. 19, 2001.
5. Young GA, Underdahl NR, Sumpton LJ, et al: Swine repopulation. I. Performance within a disease-free experiment station herd. J Am Vet Med Assoc 134:491496, 1959.
6. Caldwell JD, Underdahl NR, Young GA: Swine repopulation. III. Performance of primary SPF pigs on farms. J Am Vet Med Assoc 138:141145, 1961.
7. Wallgren P: The importance of diseases for daily growth of pigs. Proc Nord Vet Congr 17:106110, 1994.
8. Klasing KC, Laurin DE, Peng RK, Frey DM: Immunologically mediated growth depression in chicks: influence of feed intake, corticosterone and interleukin-1. J Nutr 117:16291637, 1987.
9. Noyes EP, Feeny DA, Pijoan C: Comparison of the effect of pneumonia detected during lifetime with pneumonia detected at slaughter on growth in swine. J Am Vet Med Assoc 197:10251029, 1990.
10. Straw BE, Shin SJ, Yaeger AE: Effect of pneumonia on growth rate and feed efficacy of minimal disease pigs exposed to Actinobacillus pleuropneumonia and Mycoplasma hyopneumonia. Prev Vet Med 9:287294, 1990.
11. Wallgren P, Artusson K, Fossum C, Alm GV: Incidence of infections in pigs bred for slaughter reviled by elevated serum levels of interferon and development of antibodies to Mycoplasma hyopneumoniae and Actinobacillus pleuropneumoniae. J Vet Med B 40:112, 1993.
12. Taylor DJ: Diseases of swine, Actinobacillus pleuropneumoniae. In: Straw BE, Allaire SD´, Mengeling WL, Taylor D, eds: Diseases of swine 8th edition. Ames, IA: Iowa State University Press; pp. 343354. 1999.
13. Hayakawa Y, Komae H, Ide H, et al: An outbreak of porcine pleuropneumoniae caused by Actinobacillus pleuropneumoniae serotype 1. J Jpn Vet Med Assoc 44:790795, 1991.
14. Wallgren P, Segall T, Pedersen-Mörner A, Gunnarsson A: Experimental infection with Actinobacillus pleuropneumoniae in pigs: I: Comparison of five different parenteral antibiotic treatments. J Vet Med B 46:249260, 1999.
15. Friendship RM, Hacker I, McMillan I, et al: Haemophilus pleuropneumoniae: effect on growth rate and related parameters in naturally occurring disease. Proc Int Pig Vet Soc 8:97, 1984.
16. Wallgren P, Vallgårda J: Serogrisproduktion: Presentation, definition och kravlista. (SPF pigs: Presentation, definition and specification of regulations). Swedish Vet Tidn 45:733735, 1993.
17. Johansson E, Fossum C, Fuxler L, Wallgren P: Effects of an experimental infection with Actinobacillus pleuropneumoniae on the interferon-alpha and interleukin-6 producing capacity of porcine peripheral blood mononuclear cells stimulated with bacteria, virus or plasmid DNA. Vet Microbiol 79:171182, 2001.
18. Andersson K: The SLU scale, a new feeding regime to slaughter pig. Swedish University of Agricultural Sciences, Uppsala, Sweden, Report 67, 1987.
19. Wallgren P, Persson M: Relationship between the amounts of antibodies to Actinobacillus pleuropneumoniae serotype 2 detected in blood serum and in fluids collected from muscles of pigs. J Vet Med B 47:727737, 2000.
20. McCarthy JF, Aherne FX, Okai DB: Use of HCl insoluble ash as an index material for determining apparent digestibility with pigs. Can J Anim Sci 54:107109, 1974.
21. Jennishe P, Larsson K: Conventional Swedish analytical methods for feedstuffs and plant material. SLL, Uppsala, Sweden, 60:15, 1990.
22. Nordisk
Metodkommitté: Nordic Committee on Food Analysis, Esbo, Finland, No.
6, 3rd edn., 1976.
23. Kühn I, Katouli M, Wallgren P, et al: Biochemical fingerprinting as a tool to study the diversity and stability of intestinal microfloras. Microecolo Ther 23: 140148, 1995.
24. Möllby R, Kühn I, Katouli M: Computerized biochemical fingerprinting: A new tool for typing of bacteria. Rev Med Microbiol 4:231241, 1993.
25. Kühn I, Allestam G, Stenström TA, Möllby R: Biochemical fingerprinting of water coliform bacteria a new method for measuring the phenotypic diversity and for comparing different bacterial populations. Appl Environ Microbiol 57:31713177, 1991.
26. Pijpers A, Vernooy JACM, van Leengoed LAMG, Verheijden JHM: Feed and water consumption in pigs following an Actinobacillus pleuropneumonia challenge. Proceedings, The 11 th IPVS Congress, Lausanne, Switzerland, 6:39, 1990.
27. Kaneko JJ: Clinical biochemistry of domestic animals. London: Academic Press, pp 886891, 1989.
28. Kühn I: Biochemical fingerprinting of Escherichia coli: a simple method for epidemiological investigations. J Microbiol Methods 3:159170, 1985.
29. Kühn I, Brauner A, Möllby R: Evaluation of numerical typing systems for Escherichia coli using the API 50 CH and the PhP-EC systems as models. Epidemiol Infect 105:521531, 1990.
30. Waiij D, van der., Verhoef J: New criteria for antimicrobial therapy: Maintenance of digestive tract colonisation resistance. Excerpta Medica. Amsterdam, 1979.
31. Melin L, Jensen-Waern M, Johannisson A, et al: Development of selected faecal microfloras and of phagocytic and killing capacity of neutrophils in young pigs. Vet Microbiol 54:287300, 1997.
32. Katouli M, Melin L, Jensen-Waern M, et al: The effect of zinc oxide supplementation on the stability of the intestinal flora with special reference to composition of coliforms in weaned pigs. J Appl Microbiol 87:564573, 1999.
33. Edfors-Lilja I, Wattrang E, Magnusson U, Fossum
C: Genetic variation in parameters reflecting immune competence of swine.
Vet
Imunol Immunopath 40:116, 1994.
Table
1. Clinical,
Serologic, and Pathologic Responses of SPF Pigs Exposed to an Experimental
Infection With A. pleuropneumoniae Serotype 2 Compared With the Findings
Obtained in Uninfected Control Animals*
Control (n = 5)
Infected (n = 5)
Clinical signs
Mean respiratory signs 0.0 ± 0.0 0.79 ± 0.04 P<0.001
Serum antibodies (A450)
Day 0 0.07 ± 0.04 0.07 ± 0.04 Not significant
Day 4 0.06 ± 0.01 0.13 ± 0.09 Not significant
Day 7 0.06 ± 0.02 0.50 ± 0.22 P<0.01
Day 13 0.06 ± 0.01 1.27 ± 0.43 P<0.01
Day 17 0.07 ± 0.01 1.33 ± 0.54 P<0.01
Macroscopical lesions
Pneumonia (% of lung volume) 0.0 ± 0.0 6.4 ± 5.4 P<0.05
Pleuritis (% of surface) 0.0 ± 0.0 13.4 ± 11.7 P<0.05
*For
details, see Material and methods.
Table 2.
Feed Intake and Productivity Among SPF
Pigs Inoculated with Actinobacillus pleuropneumoniae Serotype 2 on Day
0 (n = 5) or Left as Uninoculated Control Pigs (n = 5)*
Control (n = 5)
Infected (n = 5)
Appetite
Day 8 to -1 4.0 ± 1.2 4.2 ± 0.9 Not significant
Day 1 to +7 5.0 ± 0.0 4.4 ± 0.5 P<0.001
Day +7 to +17 5.0 ± 0.0 4.4 ± 0.5 P<0.001
Weight gained (kg)
Day 8 to -1 4.3 ± 0.6a 4.0 ± 0.7a Not significant
Day 1 to +7 6.7 ± 1.4b 5.9 ± 1.7b Not significant
Day +7 to +17 8.4 ± 1.5c 7.6 ± 2.0b Not significant
Daily weight gain (gram per day)
Day 8 to -1 614 ± 87a 586 ± 100
Not significant
Day 1 to +7 838 ± 178ab 735 ± 211
Not significant
Day +7 to +17 844 ± 147b 758 ± 205
Not significant
Feed conversion (kg consumed per kg gained)
Day 8 to -1 1.96 ± 0.30 2.26 ± 0.45 Not significant
Day 1 to +7 2.14 ± 0.48 2.35 ± 0.69 Not significant
Day +7 to +17 2.31 ± 0.45 2.58 ± 0.80 Not significant
*For details, see Material and methods
Different
letters within characteristic and column represents significant differences
(p<0.05)
Table 3.
The Biochemical Qualities of the Fecal
Coliform Floras over Time in Pigs Exposed to Actinobacillus pleuropneumoniae
or Left as Controls*
Control (n = 5)
Infected (n = 5)
Intestines
Fecal colifom floras
Diversity index, median 0.81 0.81 Not significant
The population similarity, 0.48 0.34 Not significant
Sp coefficient,
median
The population similarity, 0.49 ± 0.09 0.35 ± 0.09 Not significant
Sp coefficient, mean
Microscipical findings
1.
Height of villi (mm)
Proximal jejunum 12.0 ± 1.3 10.1 ± 2.7 Not significant
Distal jejunum 9.9 ± 1.8 8.4 ± 3.4 Not significant
Ileum 6.0 ± 2.9 3.5 ± 0.9 P<0.05
Colon 10.5 ± 1.7 10.3 ± 3.0 Not significant
2. Depth of crypts (mm)
Proximal jejunum 5.3 ± 1.5 6.9 ± 1.8 Not significant
Distal jejunum 6.3 ± 0.7 5.5 ± 1.2 Not significant
Ileum 5.3 ± 1.6 6.2 ± 2.6 Not significant
Colon 6.2 ± 0.9 6.1 ± 1.7 Not significant
3. Goblet cells (n)
Proximal jejunum 17.4 ± 9.8
22.2 ± 5.8
Not significant
Distal jejunum 43.6 ± 16.3 52.0 ± 19.2 Not significant
Ileum 80.0 ± 15.8 80.2 ± 19.8 Not significant
Colon 40.0 ± 21.1 47.8 ± 21.3 Not significant
*The
diversity of the rectal coliform flora within pig among samples collected
on days 0, 2, 4, 7 and 13 post inoculation was analyzed individually
for each pig. The population similarity has been compared pair wise
between all pigs within each group. The table also shows the microscopial
findings from four different locations of the gut when the pigs were
killed day 17 after infection.
Table 4.
The Total Digestibility of the Feed Nutrients
During the Passage of the Intestine by 5 Healthy SPF Pigs and by 5 SPF
Pigs Infected with A. pleuropneumoniae on Day 0
Digested part of the amount
consumed (%)
Control (n = 5) Infected (n = 5)
Crude protein (%)
Day 0 69.1 ± 5.1 74.5 ± 5.3 Not significant
Day 2 68.8 ± 2.4 74.5 ± 4.5 P<0.05
Day 4 71.3 ± 2.2 75.7 ± 6.4 Not significant
Day 7 75.3 ± 3.2 74.0 ± 2.6 Not significant
Day 13 71.6 ± 2.2 71.6 ± 2.8 Not significant
Day 17 75.2 ± 4.6 76.1 ± 2.3 Not significant
Organic matter (%)
Day 0 75.3 ± 5.1 79.0 ± 5.6 Not significant
Day 2 75.7 ± 1.5 79.7 ± 2.9 P<0.05
Day 4 75.7 ± 3.1 80.0 ± 3.5 P<0.05
Day 7 79.3 ± 1.7 80.2 ± 2.9 Not significant
Day 13 78.2 ± 1.0 76.8 ± 2.4 Not significant
Day 17 79.8 ± 3.2 79.5 ± 1.9 Not significant
Table
5. Individual
Results for Diversity of the Fecal Coliform Floras Collected From SPF
Pigs Kept Uninfected or Exposed to Actinobacillus pleuropneumoniae on
Day 0*
Litter origin Diversity Population similarity DWG
Pig index Pigs compared Sp-coefficient (g per day)
Litter A
Control C 0 0.63 C 0 vs C 2 0.65 644
Control C 2 0.57 917
Litter B
Control C 1 0.83 C 1 vs I 31 0.40 989
Infected I 31 0.81 967
Litter C
Control C 3 0.82 C 3 vs I 32 0.25 728
Infected I 32 0.92 C 3 vs I 33 0.45 717
Infected I 33 0.81 I 32 vs I 33 0.34 500
Litter D
Control C 4 0.81 C 4 vs I 34 0.56 928
Infected I 34 0.77 828
Litter E
Infected I 30 0.93 728
*The level of similarity of that flora between littermates is shown irrespective of group origin of the principal. Finally, the individual daily weight gains are shown in the Table.
Figure 1. Population similarities
(Sp) between the fecal coliform populations of SPF pigs left as uninfected
control animals (C) or infected with Actinobacillus pleuropneumoniae
(I), respectively. The relationship is shown as a cluster of Spvalues.
ISSN# 1542-2666