|
The INTERNATIONAL JOURNAL of APPLIED RESEARCH In Veterinary Medicine |
 |
| Current Issue |
| Previous Issues |
| Reprint Information |
| Back to The International Journal of Applied Research in Veterinary Medicine |
Statistical Evaluation
of ELISA Methods for Testing Caprine Paratuberculosis
Z. Dimareli-Malli
M. Samarineanu
M. Sarca
E. Zintzaras
K. Sarris§
S. Tsitsamis
Veterinary Research Institute of Thessaloniki, National Agricultural Research Foundation, Thessaloniki, Greece
Institutul National de Medicina Veterinara Pasteur, Calleo Glulasti
br 333, Sector Bucuresti, Romania.
Medical School University of Thessaly, Papakyriazi 22, Larisa 41222, Greece
§Laboratory of Microbiology of Faculty of Veterinary Medicine, Aristotelian University of Thessaloniki, Greece.
Research was financially
supported by the General Secretariat of Research and Technology of
the Hellenic Ministry for Development (Joint research program between
Greece-Romania, Bilateral-Cooperation).
KEYWORDS: Paratuberculosis, goats, ELISA, statistical evaluation
Abstract
A survey was conducted to assess the diagnostic value of four enzyme-linked immunosorbent assays (ELISAs): LAM-A, LAM-P, GP, IDEXX-ELISA, and AGIT, for sensitivity and specificity. The assessment was based on two groups of adult goats: group 1 consisted of 44 goats infected with paratuberculosis; group 2 consisted of 73 clinically healthy goats belonging to 12 known paratuberculosis-infected herds in Northern Greece. Sera were taken from 62 known negative goats from two herds that had no clinical history of paratuberculosis and were repeatedly fecal culture test negative. In group 1, the goats were tested using tissue culture or histopathology, and in group 2, they were tested using fecal culture. These tests were used as gold standards. The four ELISA methods were compared using receiver operating characteristics (ROC) analysis. The AGIT method was evaluated using the McNemars test. For group 1, all methods had a good overall diagnostic accuracy. Sensitivities (SE) ranged from 0.82 to 0.91 (for LAM-A and GP, SE = 0.91; for LAM-P, SE = 0.87; for IDEXX, SE = 0.82; and for AGIT, SE = 0.84). For group 2, the overall diagnostic accuracy of methods is limited. LAM-A, GP, and IDEXX had identical sensitivities (SE = 0.55) The LAM-P had SE = 0.45. The AGIT had low sensitivity (SE = 0.09). The specificities of ELISA methods ranged from 0.79 to 0.95 (LAM-A = 0.79 and GP = 0,86; for LAM-P = 0.92 and IDEXX = 0.96). The AGIT had high specificity (SP = 1).
Introduction
Paratuberculosis, or Johnes disease, is a chronic granulomatous enteritis of ruminants caused by M. a. paratuberculosis (MAP).1 In small ruminants, the only consistent, though nonspecific, clinical sign of the disease is progressive weight loss. Diarrhea is not a constant feature and is often intermittent, although it can be severe in some goats in individual herds.2
The prevalence of the disease in goats in Greece is high, and infection is the cause of significant economic loss. To reduce the infection rate in a flock, detecting and culling infected animals at an early stage of infection and preventing transmission of MAP to young livestock within an infected flock are important. Effective detection of subclinical cases of caprine Johnes disease is a critical step in the reduction of disease prevalence in infected goat flocks.
The serologic diagnosis of Johnes disease has long been hampered by a lack of specific and sensitive tests. The practicing veterinarian needs a rapid, economic, reliable test to confirm a case of clinical Johnes disease and to detect the subclinically infected animal. Sherman et al.3 evaluated an agar gel immunodiffusion (AGIT) test as an aid in differential diagnosis of Johnes disease. AGIT might be a highly sensitive and specific test in ruminants with clinical signs suggestive of Johnes disease.
Numerous modifications in enzyme-linked immunosorbent assay (ELISA) methods have been evaluated. Improvements include preabsorbing the test sera with a suspension of M. phlei4 and using an affinity-purified peptide antigen.5 Efforts to identity nonprotein antigens are also being pursued. Sugden et al.6 observed higher sensitivity than the commercial ELISA using the lipoarabinomannan antigen in an experimental ELISA when diagnosing paratuberculosis in sheep.
An ELISA for the detection of antibodies against M. a. paratuberculosis in cattle was evaluated based on a GP (proteinic) antigen. The M. phlei-absorbed ELISA under field condition had a 57% sensitivity and a 99% specificity using fecal culture or histopathology positivity as the gold standard signifying true infection.7
The goal of this study was to assess the diagnostic value of four ELISA tests: LAM-A, LAM-P, GP, IDEXX ELISA, and the AGIT in terms of sensitivity (SE) and specificity (SP).
Materials and methods
Sampling
A total of 117 adult goats belonging to 12 known
paratuberculosis-infected herds in Northern Greece were tested using
bacteriology, histopathology, and serologic tests. The 44 clinical
cases were selected on the basis of chronic weight loss from herds
with established paratuberculosis problems, and the diagnosis was
confirmed by microscopical examination, culture, or histopathology.
The remaining 73 goats were free of clinical signs.
Serum samples were obtained from all animals described. Sera from 62 known negative goats from two herds that had no clinical history of paratuberculosis and were repeatedly fecal culture test negative were used as negative controls.
Tissues and Feces
Intestinal and lymph node samples were collected from the 44 clinical cases (total 88 samples) and were cultured for M. a. paratuberculosis. Fecal specimens were collected from the 73 goats free of clinical signs and were cultured for MAP.
Bacteriology
Tissues and fecal samples were decontaminated with NaOH and inoculated into Herrolds egg yolk medium with mycobactin j 2mg/L (Merieux).
Serological Tests
The IDEXX-ELISA
was performed as recommended by the manufacturer (IDDEX, Corporation
Portland, ME, U.S.A.). Briefly, serum samples were absorbed with an
absorbent for 60 minutes at room temperature. 100 mL of absorbed sera
were added to the appropriate wells of the antigen-coated microtiter
plates and incubated for 60 minutes at room temperature. Afterwards,
100 mL of horseradish peroxidase (HRPO) protein G conjugate was added
to each well. After addition of the substrate reactive with HRPO,
the result is indicated by color development. The color is measured
using a microplate reader at a single wavelength of 450 nm.
The three ELISA kits, LAM-A, LAM-P, and GP, were performed as recommended by the manufacturer (Institute Pasteur of Bucharest, [AU: Please give location in Romania.]Romania). Serum samples were diluted 1/200 with PBS + 1% BSA. Then, 100 mL of diluted serum were added to the covered microplates and incubated for 15 minutes at 37˚C. Afterward, 100 mL of peroxidase conjugate was added to each well, and 100 mL of ABTS in substrate buffer was also added. The reaction was stopped with NAF in 6 mL deionized water, and the optical densities (OD) were measured at 405 nm.
Sera were examined by AGIT using antigen prepared by ultrasonication of M. a. paratuberculosis strain 316 F.
For each test the optical densities (OD) were recorded. For AGIT the disease status was recorded in binary form (diseased or not diseased).
Statistical Methods
The four ELISA methods (LAM-P, LAM-A, GP, IDEXX)
were compared using ROC curve analysis. The AGIT method was evaluated
using the McNemars test. In the ROC curve analysis, a curve is constructed
by plotting the sensitivity against 1 specificity over a range of
cutoff OD values. When the area under the curve (AUC) is equal to
its minimum value of 0.5, the diagnostic method has no accuracy at
all. The method has the best accuracy when the AUC has its maximum
value of 1.8 The best cutoff value of the diagnostic method is defined
by the value that best compromises between the highest sensitivity
and specificity values, ie, discriminates between diseased and non-diseased
animals. The AUC under the ROC curve and the cut-off with the highest
sensitivity and specificity for each antigen were calculated.
The significance
of the AUC was determined by the method described by Hanley and McNeil,9
in which the standard error of the AUC is calculated parametrically
and its 95% confidence interval (CI) is asymptotic. The specificity
and sensitivity cut-off differences were evaluated by comparing the
confidence intervals.10 The analysis was performed using SPSS and
Fortran subroutines.
Results
At necropsy, the 44 clinically affected goats generally had the clear gross lesions of thickened and inflamed ileum, and Ziehl- Neelsen staining revealed clumps or abundant small slender acid-fast bacteria.
In group 1, 25 of
44 tissue specimens were culture positive in Herrolds medium while
the remaining (19) were culture negative but histopathology positive.
In group 2, 11 samples were detected as fecal culture positive and
62 as negative. The serologic reactors in four ELISAS and AGIT tests
in relation to tissue culture histopathology (group 1) and fecal culture
(group 2) are shown in Tables 1 and 2. Table 3 shows the results of
control goats in ELISAS and AGIT.
The specificities of ELISA methods ranged from 0.79 to 0.95 (for LAM-A, 0.79; GP, 0.86; LAM-P, 0.92; IDEXX, 0.96). The AGIT had high specificity (SP = 1).
For Group 1
Figure 1 illustrates the ROC curves for the tissue culture and histopathology data. The AUC with the corresponding standard error (SE) of each curve is shown in Table 1. The AUC of each method is significantly different from 0.5 (P < 0.05), and the upper limits of 95% CIs approach the value of 1, indicating that the methods have a good overall diagnostic accuracy. The GP has the highest AUC (0.959 ± 0.027), and the IDEXX has the lowest AUC (0.894 ± 0.041). For selected cutoff values (see Table 5), the methods have and sensitivities ranging from 0.84 to 0.91 (for LAM-A and GP, SE = 0.91; for LAM-P, SE = 0.87; for IDEXX, SE = 0.82). The 95% CIs are overlapping, and the upper limit approaches the value 1. AGIT has SE = 0.84 and SP = 1, and it agrees with the tissue culture and histopathology data (P = 0.023).
Group 2
Figure 2 illustrates
the ROC curves for the fecal culture data. The AUC with the corresponding
SE of each curve is shown in Table 6. The AUC of each test is not
significantly different from 0.5 (P > 0.05), indicating that the
overall diagnostic accuracy of these methods is limited. However,
the LAM-A has the highest AUC (0.671 ± 0.089) compared with the other methods, and the
LAMP-P has the lowest AUC (0.551 ± 0.121). For
selected cutoff values (Table 7), the LAM-A, IDEXX, and GP have identical
sensitivities (SE = 0.55). The LAM-P has a slightly lower sensitivity
(SE = 0.45). The 95% CIs for the SE and the SP are overlapping; however,
only the upper limit for SP of LAM-P is approaching the value 1. The
AGIT is not useful at all in terms of sensitivity (SE = 0.09), but
it has a perfect specificity (SP = 1). However, the method is associated
with the fecal culture results (P < 0.004).
Discussion
The diagnosis of
paratuberculosis in goats and sheep can be difficult, particularly
for an individual animal. Serologic tests combined with a clinical
examination and a microscopic and bacteriologic examination of feces
are commonly used as diagnostic indicators in ruminants. However none
of these tests is definitive.
In sheep, culture
is often unsuccessful, and no test reliably identifies subclinical
forms of the disease.11 For the two groups, the results of four ELISAs
did not mark significant differences in test specificity. The exceptions
were IDEXX and LAM-P, with estimated specificities of 0.95 and 0.92,
respectively. Therefore, IDEXX and LAM-P seem to be more specific
than LAM-A and GP ELISA.
In the cases of 44 clinically affected goats, no significant differences were seen among all methods in test sensitivity. LAM-A and GP detected more tissue culture- or histopathology-positive goats (91%) than LAM-P (87%) and IDEXX (82%). These results are comparable to those seen for application of an ELISA technique based on a lipoarabinomannan antigen, with a positive predictive value of 74% and a negative predictive value of 99%, using the ileocecal lymph node culture as the gold standard.12
The usefulness of serologic testing for clinically diseased animals was shown by the high sensitivity of the AGIT and ELISA tests. In the four ELISA tests of the 44 clinically affected goats, the optical densities of 36 sera in LAM-P, 31 in IDEXX, 28 in LAM-A, and 26 in GP were greater than the mean positive control value. Of the 44 culture- or histopathology-positive animals, 37 were AGIT positive and diseased. Of the 11 fecal culture-positive animals, one was AGIT positive but not diseased.
The high antibody
levels of these goats appeared to correlate with clumps of or abundant
mycobacteria. However, the sensitivity of the ELISA test is highest
for animals in the later stages of the disease, usually when the animals
develop clinical signs. 13 Animals with clinical symptoms of paratuberculosis
in most cases show high titers until breakdown, which facilitates
diagnosis.14
Similar studies on goats gave ELISA sensitivities between 54% and 88.2%, with 65.2% to 73% sensitivity for the AGIT test.15-18 In a serologic survey for ovine paratuberculosis, the sensitivity of two commercial ELISA tests was 50.9%.19
For the group of 73 goats free of clinical signs, the results did not mark significant differences in test sensitivity. In cases of clinically healthy goats results of LAM-P ELISA showed a better correlation with those of fecal culture than the findings of LAM-A. This confirms the observations of Jark et al.12 and Gasteiner et al.,14 assigning H-ELISA (Hannover ELISA) high specificity in identifying subclinically infected animals. This is probably due to use of the antigen from M. a. paratuberculosis instead of antigen from M. a. avium applied in case of LAM-A ELISA. LAM-P ELISA clearly detected fecal culture-negative sera in 92%, which LAM-A only did in 79%.
Additionally, the serum samples of fecal culture positive animals were positive in 55% by LAM-A ELISA and only in 45% by LAM-P. These diversities between the results of both ELISA methods are similar with those of Gasteiner et al.14 They estimate that these diversities may be caused by the presence of antibodies that reacted strongly with the antigen of M. a. avium but not or weakly with M. a. paratuberculosis.
LAM-A and GP ELISA had identical sensitivities in clinically infected animals and identical sensitivity in clinically healthy animals but different specificities of 0.79 and 0.86, respectively. Although both methods use different antigens, M. a. avium for LAM-A and M. a. paratuberculosis for GP-ELISA, there is agreement between them.
The sensitivity
results are comparable to those seen for application of commercial
ELISA in goats for which 54% of fecal shedders were ELISApositive18
and in cattle for which 57% of fecal culture or histopathology positive
samples were ELISA positive.
With all ELISA tests, however, not all fecal culture-positive animals were identified. Milner et al.20 clearly state that animals in the early stages of infection, even if shedding the organism, cannot necessarily be identified by ELISA. This is because months or even years may elapse before seroconversion, limiting the value of the ELISA and any other serologic tests in any scheme for the eradication of paratuberculosis.
Additionally, the clinical signs and the intermittent nature of fecal shedding became a major determinant of sensitivity for ELISA and perhaps for any serologic test. Most goats in the first stage of the disease are lightly infected and have negative fecal cultures and essentially no detectable antibody in serum.
Poor or low sensitivity has also been described for ELISA tests using the LAM antigen21 to detect lightly infected cattle, as well as agar gel immunodiffusion tests.3
AGIT appeared to be specific for both cases of goats and sensitive (0.84) for clinically infected animals. However, is not useful at all in terms of sensitivity (SE = 0.09) in clinically healthy goats. As shown previously by Huchzermeyer and Bastianello,22 the AGIT test did not prove to be an effective method to diagnose paratuberculosis sheep in the first stage of the disease.
Thus, the sensitivity shown in subclinical cases is not sufficient to base a control program on the ELISA alone. However, if ELISA is used in conjunction with one or possibly more methods in a strict testing program, caprine paratuberculosis may be successfully controlled and eventually eradicated from Greece.
References
1. Chiodini RJ, Van Kruiningen HJ, Merkal RS: Ruminant paratuberculosis (Johne s disease): The current status and future prospects. Cornell vet 74:218262, 1984.
2. Eamens G: Johne s disease in goats. In: .Milner A, Wood P, eds: Current trends in research, diagnosis and management CSIRO. Australia 105112, 1989.
3. Sherman DM, Markham RJF, Bates F: Agar gel immunodiffusion test for diagnosis of clinical paratuberculosis. J Am Vet Med Assoc 185:179182, 1984.
4. Yokomizo Y, Merkal RS, Lyle PAS: Enzyme-linked immunosorbent assay for detection of bovine immunoglobulin G1 antibody to a protoplasmic antigen of Mycobacterium paratuberculosis. Am J Vet Res 44:22052207, 1983.
5. Abbas B, Riemann HP, Lonnerdal B: Isolation of specific peptides from Mycobacterium paratuberculosis protoplasm and their use in an enzymelinked immunosorbent assay for the detection of paratuberculosis (Johnes disease) in cattle. Am J Vet Res 44:22292236, 1983.
6. Sugden EA, Corner AH, Samagh BS, et al: Serodiagnosis of ovine paratuberculosis, using lipoarabinomannan in an enzyme-linked immunosorbent assay. Am J Vet Res 6:850854, 1989.
7. Milner AR, Mack WN, Coates KJ, et al: The sensitivity and specificity of a modified ELISA for the diagnosis of Johne s disease from a field trial in cattle. Vet Microbiol 25:193198, 1990.
8. Plebani M, Borghesan D, Bernardi D, et al: Clinical evaluation of a new quantitative method for specific IgE antibodies. Eur J Clin Chem 34:579584, 1996.
9. Hanley JA, McNeil BJ: The meaning and use of the area under a receiver operating characteristic (ROC) curve. Radiology 143:2936, 1982.
10. Plebani M, Bernardi D, Basso D, et al: Measurement of specific immunoglobulin E: Intermethod comparison and standarization. Clin Chem 44:19741979, 1998.
11. Collins MT, Sockett DC: Accuracy and economics of the USDA-licensed enzyme-linked immunosorbent assay for bovine paratuberculosis. J Am Vet Med Assoc 203:14561463, 1993.
12. Jark U, Ringena I, Franz B, et al: Development of an ELISA technique for serodiagnosias of bovine paratuberculosis. Vet Microbiol 51:189198, 1997.
13. Milner AR, Mack WN, Coates K, et al: Johne s disease. CSIRO-Australia 1988.
14. Gasteiner J, Awad-Masalmeh M, Baumgartner W: Mycobacterium avium subsp.paratuberculosis infection in cattle in Austria, diagnosis with culture, PCR and ELISA. Vet Microbiol 77:339349, 2000.
15. Milner AR, Mack WN, Coates K: A modified ELISA for the detection of goats infected with Mycobacterium paratuberculosis. Aust Vet J 66:305307, 1989.
16. Molina A, Morera L, Lanes D: Enzyme-linked immunoabsorbent assay for detection antibodies against Mycobacterium paratuberculosis in goats. Am J Vet Res 52:863868, 1991.
17. Dimareli-Malli Z, Sarris K, Xenos G, Papadopoulos G: Comparison of the ELISA, AGIT and CF tests for the diagnosis of caprine and ovine paratuberculosis. In: Proceedings on the Third International Colloquium on Paratuberculosis. Orlando, Fl. USA, September 28-October 2, 1991, pp. 151155, 1991.
18. Burnside DM, Rowley BO: Evaluation of an enzyme-linked immunosorbent assay for diagnosis of paratuberculosis in goats. Am J Vet Res 55:465466, 1994.
19. Michel AL, Bastianello SS: Paratuberculosis in sheep: An emerging disease in South Africa. Vet Microbiol 77:299307, 2000.
20. Milner AR, Lepper AWD, Symands WN, Gruner E: Analysis by ELISA and western blotting antibody reactivities in cattle infected with Mycobacterium paratuberculosis after absorption with M. phlei. Res Vet Sci 42:140144, 1987.
21. McNab WB, Meek AH, Martin SW, Duncan JR: Associations between lipoarabinomannan enzymeimmuno-assay test results, for paratuberculosis and farm management factors. Prev Vet Med 13:3951, 1992.
22. Huchzermeyer HF, Bastianello SS: Serological, microscopic, cultural and pathological findings from 135 sheep originating from a paratuberculosis flock in South Africa. In: Proceedings on the Third International Colloquium on Paratuberculosis, Orlando, FL., USA, September 28-October 2, 1991,140146, 1991.
Recommended Reading
Ridge SE, Morgan JR, Sockett DC, et al: Comparison of the Johne s absorbed EIA and the complement fixation test. 1991.
Sockett DC, Conrad TA, Thomas CB, Collins MT: Evaluation of four serological tests for bovine paratuberculosis. J Clin Microbiol 30:11341139, 1992.
Sugden EA, Samagh BS, Bundle DR,
Duncan JR: Lipoarabinomannan and lipid-free arabinomannan antigens
of Mycobacterium paratuberculosis Infect Immun 55:762770, 1987.
Table
1. Number of Serologic Reactors in Four ELISA and AGIT Tests in Relation
to Tissue Culture or Histopathology From Paratuberculosis Clinical
Cases
Tissue
culture or Serologic Tests
histopathology LAM-P LAM-A
GP ELISA
positive ELISA ELISA
ELISA IDEXX AGIT
44 38+ 40+ 40+ 36+ 37+
6 4 4 8 7
Table
2. Number of Serologic Reactors in Four ELISAS and AGIT Tests in Relation
to Fecal Culture From Clinically Healthy Goats
Serologic
Tests
Fecal Culture LAM-P LAM-A
GP ELISA
Positive ELISA ELISA
ELISA IDEXX AGIT
11 5+ 6+ 6+ 6+ 1+
6 5 5 5 10
Table
3. Results of Control Goats in Four ELISAS and AGIT
Serologic
Tests
Control
LAM-P LAM-A
GP ELISA
goats ELISA ELISA
ELISA IDEXX AGIT
62 57 49 53 59 62
5+ 13+ 9+ 3+
Table
4. The AUC Values of the ROC
curves for Group 1 With the Corresponding Standard Errors, Significant
Levels, and 95%
Confidence Intervals
Std. Asymptotic Asymptotic
AUC Error Sig. 95%
CI
Test
Result
Lower Upper
Variable(s)
Bound Bound
LAM_P .934 .032 .000 .870 .997
LAM_A .947 .028 .000 .892 1.002
GP .959 .027 .000 .906 1.012
IDEXX .894 .041 .000 .813 .974
Table
5. Cutoff Points of the Four ELISA Methods for Group 1 With the Corresponding
Sensitivities
Method Cutoff Se
LAM-P 0.45 0.87
(0.77, 0.97)
LAM-A 0.48 0.91
(0.83, 0.99)
GP 0.413 0.91
(0.83, 0.99)
IDEXX
0.163 0.82
(0.70, 0.93)
*Standard
error is 0.
Table
6. The AUC Values of the ROC Curves for Group 2 With the Corresponding
Standard Errors, Significant Levels, and 95% Confidence Intervals
Std. Asymptotic Asymptotic
AUC Error Sig. 95%
CI
Test
Result
Lower Upper
Variable(s)
Bound Bound
LAMP_P .551 .121 .589 .315 .788
GP .658 .102 .096 .458 .858
LAMP_A .671 .089 .072 .496 .846
IDEXX .604 .104 .274 .401 .807
Table
7. Cutoff Points of the four ELISA Methods for Group 2 and Control
Group
With the Corresponding Sensitivities and Specificities Respectively
Method Cutoff Se SP
LAM-P 0.724 0.45 0.92
(0.16, 0.74) (0.85, 0.99)
LAM-A 0.582 0.55 0.79
(0.26, 0.84) (0.69, 0.89)
GP 0.899 0.55 0.86
(0.26, 0.84) (0.77, 0.95)
IDEXX 0.163 0.55 0.95
(0.26, 0.84) (0.91, 0.99)
*Standard error is 0.
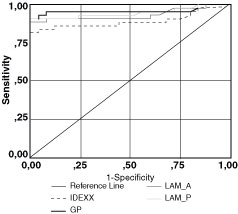
Figure 1. ROC
curves for comparing the four ELISA methods (LAM-A, LAM-P, GP, IDEXX-ELISA)
in group 1). The gold standard was the tissue culture or the histopathology
results. The AUC values of the curves with the corresponding standard
errors, significant levels, and 95% confidence intervals (CI) are
shown.
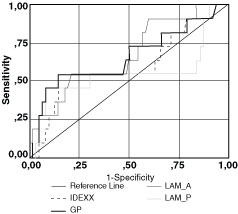
Figure 2. ROC
curves for comparing the four ELISA methods (LAM-A, LAM-P, GP, IDEXX-ELISA)
in group 2. The gold standard was the tissue culture or the histopathology
results. The AUC values of the curves with the corresponding standard
errors, significant levels and 95% confidence intervals (CI) are shown.
ISSN# 1542-2666